If you click on this menu item, the external Grafana tool will open in a new window, where you can create various dashboard visualizations of your device data and digital twin data points as well as alarms. With the appropriate user rights, you can apply the different functions. Here you can find a detailed manual on how to use Grafana: https://grafana.com/docs/
Grafana User Management & Single Sign-On (SSO)
Niotix Grid integrates Grafana seamlessly into the platform’s role and permission system.
Grafana users are automatically created and managed based on the user roles and permissions in Niotix Grid. Manual user management in Grafana is not required.
Automatic User Provisioning & Mapping Niotix Permissions to Grafana Roles
When a user is created in Niotix Grid, a corresponding user is also created in Grafana. The mapping of Niotix permissions to Grafana roles is handled as follows:
| Niotix Permission | Grafana Role |
|---|---|
all.manage |
Admin |
all.read |
Viewer |
DigitalTwin.manage |
Editor |
DigitalTwin.read |
Viewer |
VirtualDevice.manage |
Editor |
VirtualDevice.read |
Viewer |
IotHub.manage |
Editor |
IotHub.read |
Viewer |
If a user has multiple permissions, the highest required Grafana role is applied automatically (e.g., Editor takes precedence over Viewer).
Viewing device data from the IoT Data Hub
The prerequisite for using the Grafana tool is to enable “Reporting” and “Dashboard Instance” under the “Modules” menu (Settings > Permissions > Modules). Note that each of the devices you use for data visualization must have a stored device type. In addition, the assignment of the types to the target variables under the “Type definition” field in the respective parser of the device type is necessary to index measured values in InfluxDB and visualize them with Grafana.
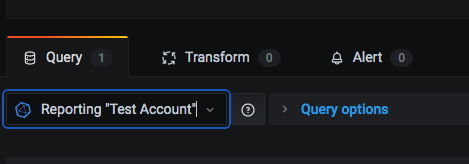
Select the ‘Reporting “{account name}”’ data source in the query before creating the dashboard:
Display data states from Digital Twins
You also have the option to visualize data states from the digital twin in Grafana. Prerequisite for this function is the activation of the “States InfluxDB Datasource” under Settings > Permissions > Modules > Integrations.
In addition to the automated option mentioned above, there is also the manual option to create the data source in Grafana. For this, you first create a new API key (Settings > Accounts > API Key) to which you assign the role “InfluxDBReader” for the desired access area (account). This role allows access to the influx data of the account to which this permission has been explicitly assigned in an API key, without inheritance or access to the sub-accounts.
In the Dashboard Builder, you then perform the following steps to create another Influx data source alongside the existing ‘Reporting “{account name}”’ data source, which is only responsible for displaying data from the IoT Data Hub:
-
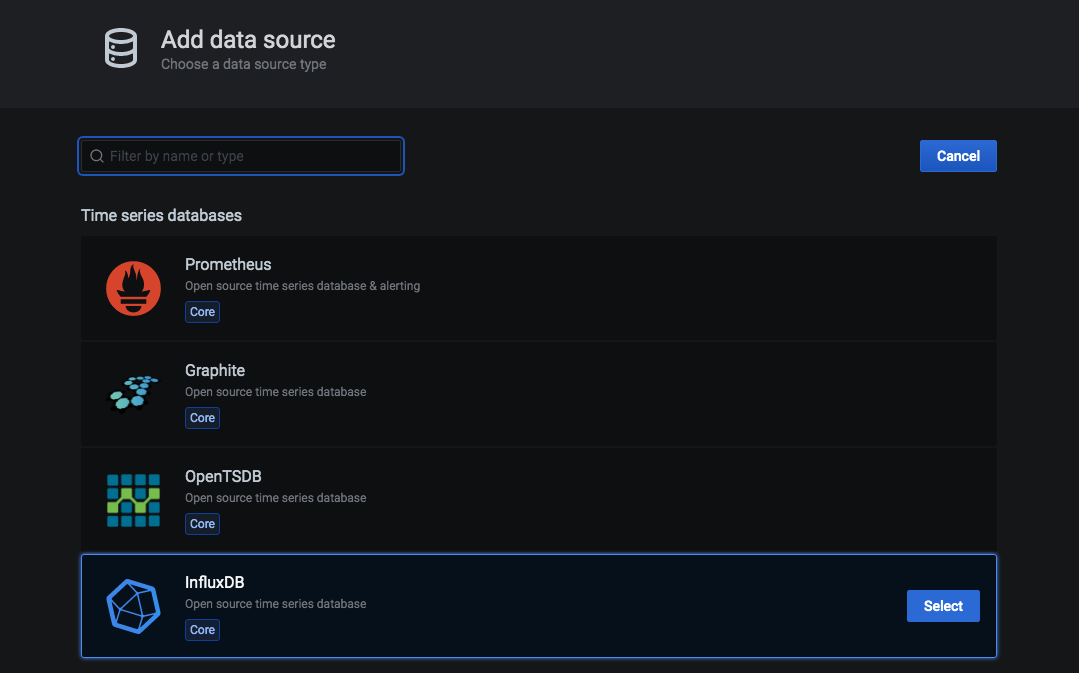
Add a new InfluxDB data source.
-
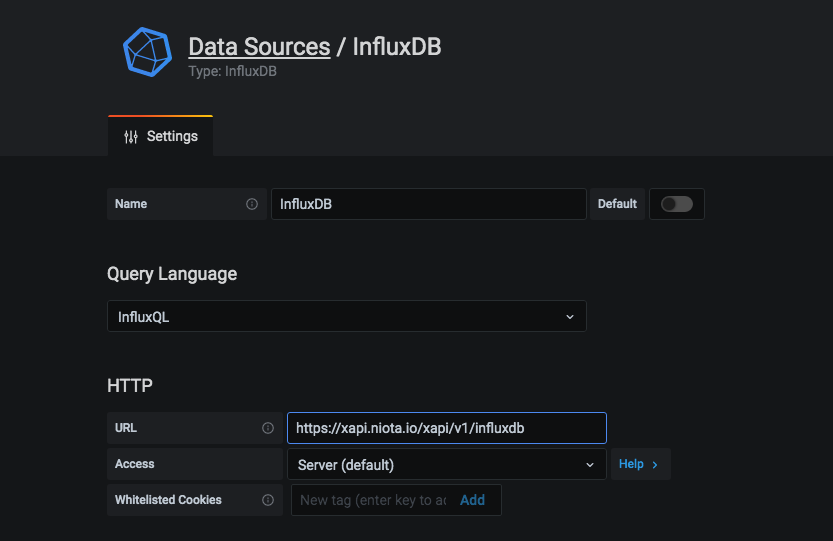
Give the new data source a title.
-
Enter the following URL under HTTP: https://xapi.niota.io/xapi/v1/influxdb
-
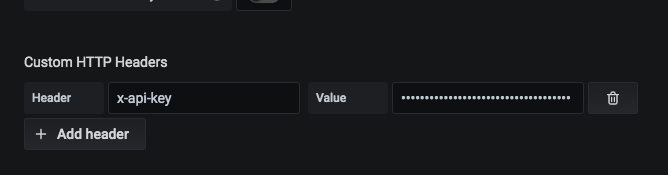
Add a new header with “x-api-key” and the previously created API key as a value in the “Value” field on the right.
-
Set the HTTP method with “POST” and click on “Save & Test”.
This is how you then generate a database query to create a dashboard for data points from the Digital Twin:
-
Before creating the dashboard, select the newly created data source in the query, for example:
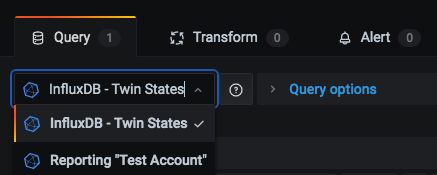
-
First select “states_history” under “select measurement”.
-
Under “select” select “field(value_number)” (instead of “field(value)”).
-
Now select the tags that refer to the data point(s) you want to visualize.
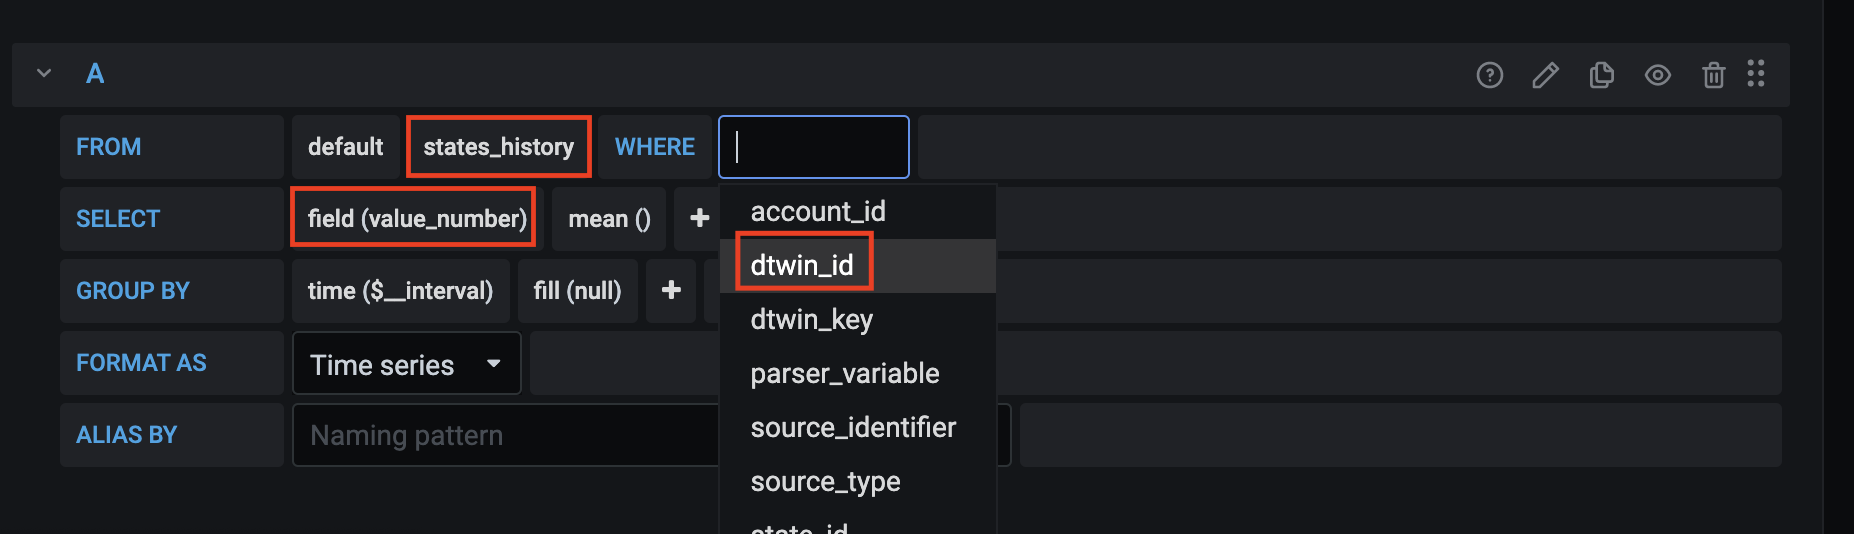
-
Under “group by” replace the “fill(null)” with “fill(none)”. The result is a graph with the data points.
Info: There is a limit of max. 5000 data points to be visualized in Grafana, if you are using an asterisk ("*") in your query