Smart Groups make it possible to group devices based on freely selectable filter criteria. In combination with the device statistics function, which includes KPIs and packet diagrams, Smart Groups offer comprehensive options for the efficient management and monitoring of IoT devices in niotix.
The main functions of the Smart Groups are:
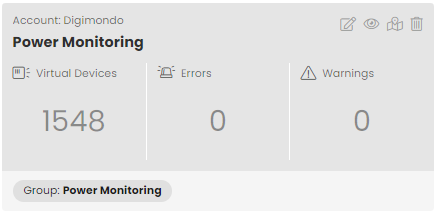
- Tile view: Once a Smart Group has been created, it appears as a tile in the overview and provides quick access to a specific set of devices.
- Aggregation of information: A Smart Group contains information such as the associated account, the title for identification, the number of Virtual Devices, the number of errors and warnings and the filter criteria.
- Device statistics: The device statistics feature allows you to see important statistics about the devices in a Smart Group. This includes packet quantities per day and per hour as well as total number of devices and number of active devices.
- Map view: Using the map view, all devices from the Smart Group are displayed on a map.
Management of Smart Groups
A new Smart Group can be created using the “Create” button (). The group can be configured in a dialog that opens. The account to which the Smart Group is to be assigned must first be selected. A title is added to make it easier to find the Smart Group later in the overview. The desired devices to be included in the Smart Group can optionally be selected via the filter. If no filter is selected, the Smart Group contains all devices in an account.
By default, filters work on “partial hits”, i.e. a filter for Id 123 finds both the device with the Id 123 and all other devices with this character combination, e.g. 1123 or 51234. To get only “exact hits”, the filter criterion must be set to “”, e.g. “123”.
If a Smart Group is created, it appears as a tile in the overview.
In the overview, the Smart Groups can be filtered using the “Account filter” button ().
A Smart Group groups any number of Virtual Devices. A single Virtual Device can be available in several Smart Groups. The Smart Group is not a property of the Virtual Device and therefore has no effect on it.
Functions in detail
The individual functions are described below using the available views.
Tile view
The following fields are available in the tile view:
- Account: The account for which the Smart Group was created. All Virtual Devices in this Smart Group must be assigned to this account.
- Title: Helps to find a Smart Group in the overview
- Virtual Devices: The number of Virtual Devices in this group.
- Errors: The number of Virtual Devices in this group whose health status contains an error.
- Warnings: The number of Virtual Devices in this group whose health status contains a warning.
- Filter criteria: The filter criteria used to define this Smart Group.
Clicking on the number of devices takes you to a filtered list view of the Virtual Devices. The following buttons are also available:
- Pencil icon (): Edit the meta properties of the Smart Group
- Eye icon (): View the Smart Group (alternatively by clicking on title)
- Map icon (): Jump to the map view for the Smart Group
- Trash can icon (): Delete the Smart Group
If you have organized your devices in groups, you can also use the group as a filter criterion for your Smart Group, for example for a specific project. You can then use additional criteria to filter out devices of a certain type, for example.
“Dashboard” tab
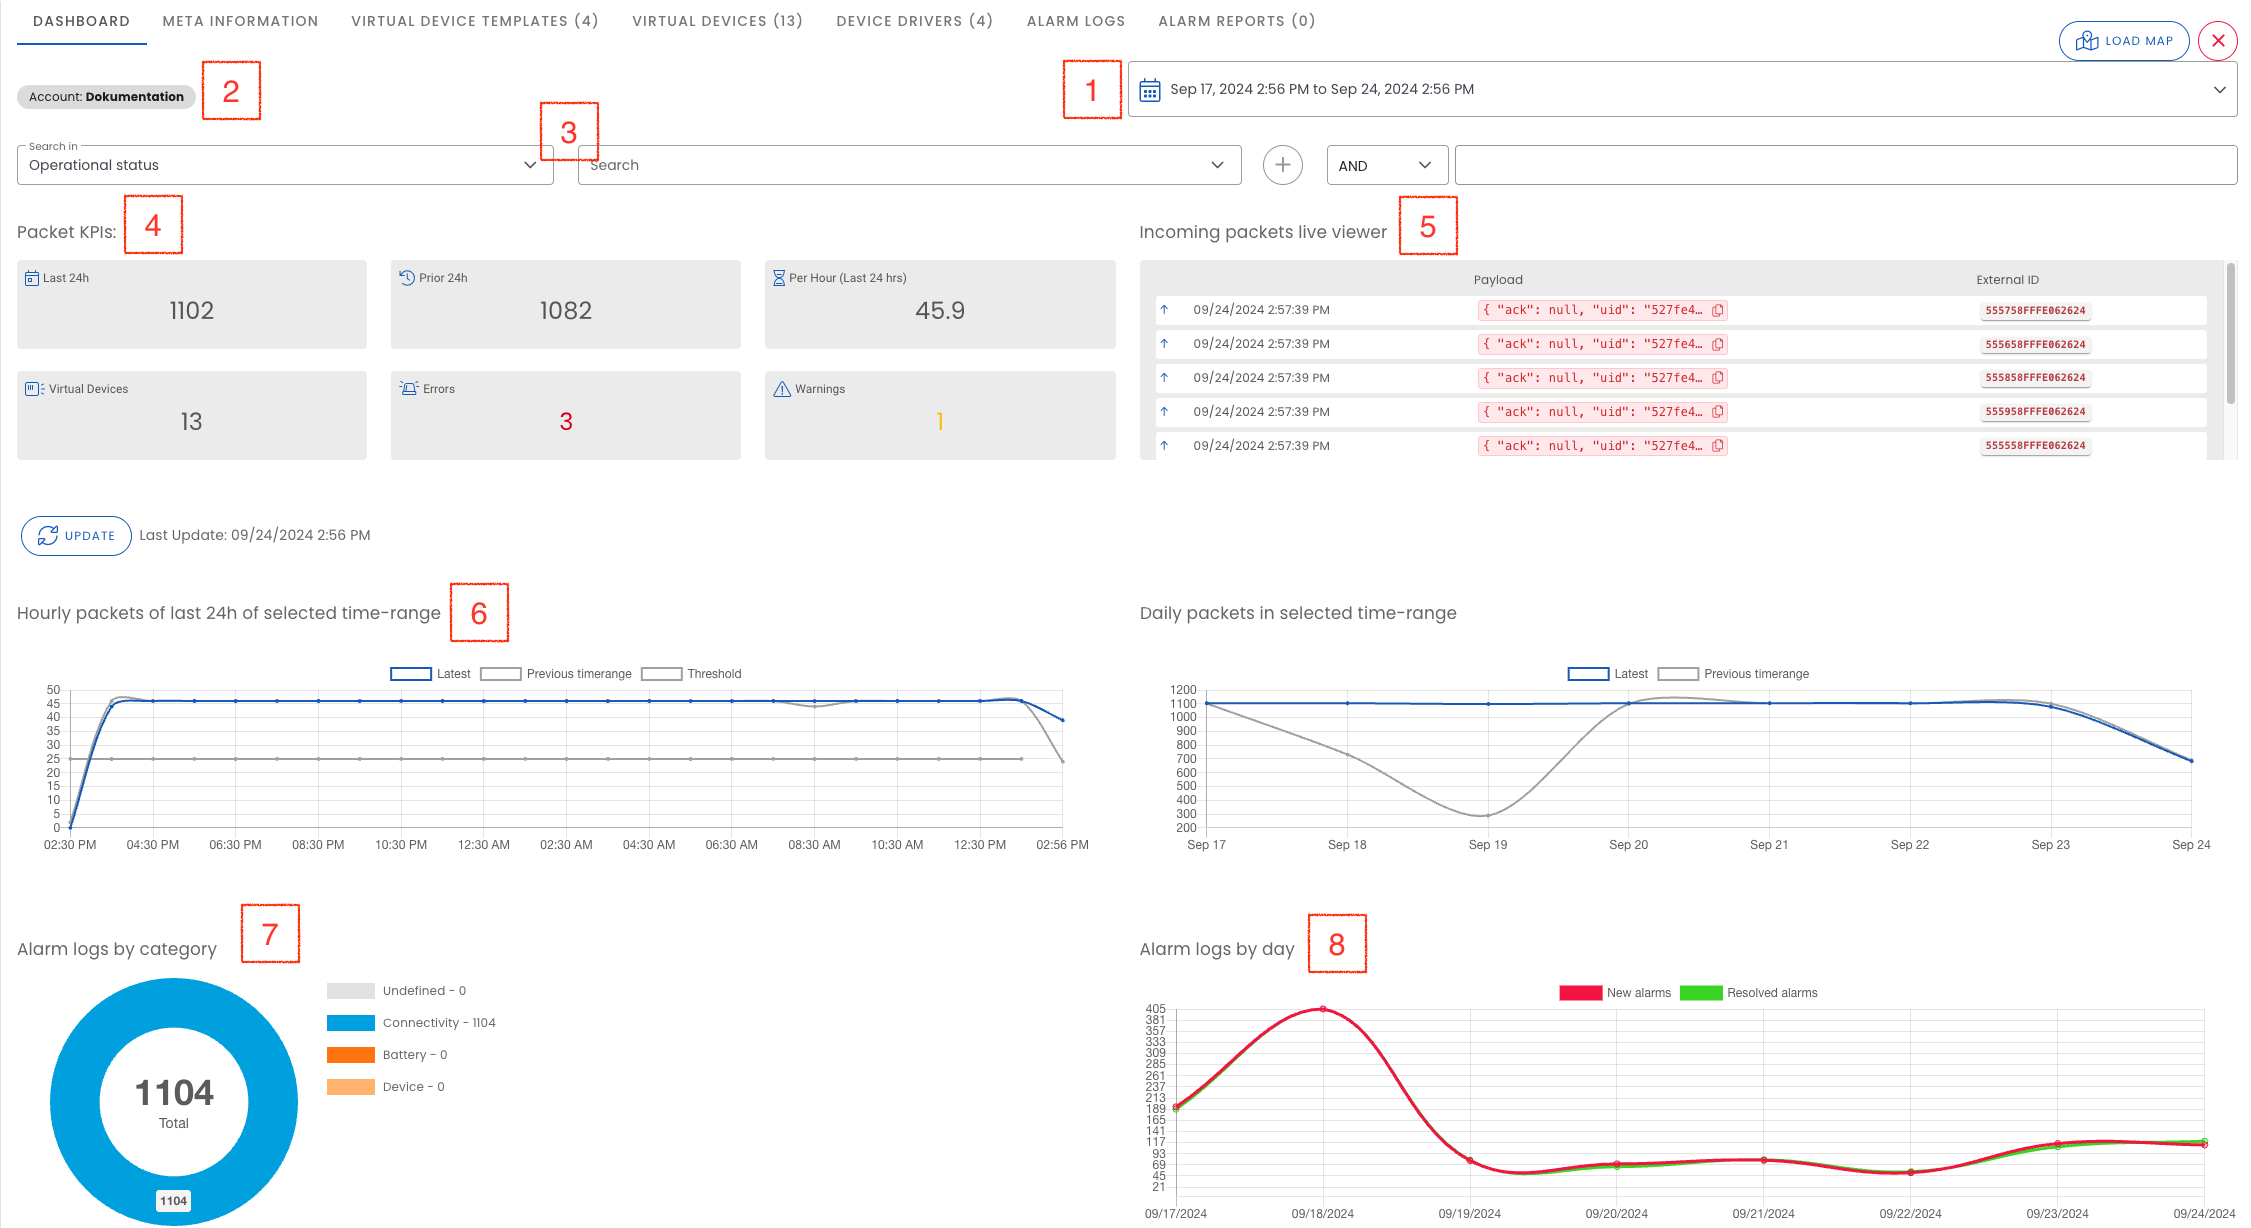
Different views are available in this tab, which can be used to analyze the transmission behavior of the devices for a defined period of time.
-
Date selection (1): Via the date selection, the period for the diagrams with daily aggregations can be selected (number of packets, active devices and total number of devices in selected period).
-
Filter (2): The filter criteria of the group are listed here.
-
Filtering statistical data (3): Statistical data can be filtered here according to operating status (in operation / not in operation) and connection type (device type). This makes it possible to only display data from active devices.
-
“Packet KPIs” view (4):
- “last 24h” and “previous 24h”: The number of packets in the last 24 hours and the 24 hours before that. These two key figures can be used to quickly determine a deviation in the case of daily or more frequent transmission behavior of the sensors.
- “Per hour (last 24h)”: the average of hourly packets within the last 24 hours
- Virtual Devices: The number of Virtual Devices in the Smart Group
- Errors: The number of devices with one or more errors
- Warnings: The number of devices with one or more warnings
-
“Incoming packets live viewer” (5): New incoming packets are displayed here. Click on a device ID (“External ID”) to go to the Virtual Device.
-
Line chart “Hourly packets of last 24h of selected time-range” (6): This diagram shows the data per hour for the last 24 hours compared to the 24 hours of the previous day. This allows deviations from the usual sending behavior to be analyzed and detected more precisely. This is particularly useful for daily transmission behavior or a higher transmission interval. In the case of monthly sending behavior, the daily values with a period of 31 days can be used. Event-based sending behavior reduces the informative value of the packet diagrams.
-
Line diagram “Daily packets in selected time-range”": The buzzer of all packets of the Smart Group per day is shown here in comparison to the previous period. This is particularly useful for weekly or monthly sending behavior. Depending on the selected time period, the first and last day may be partial days.
-
Pie chart ‘Alarm logs by Category’ (7): Shows the total number of alarm log entries generated in the selected time period, regardless of whether they have already been resolved.
-
Line chart ‘Alarm logs by Day’ (8): Shows new and resolved alarm logs over time.
If several days are to be selected via the date selection, enter whole days via a corresponding time. Otherwise, the first or last day are not complete as the current time is used as a reference. The diagrams with daily values (number of packets, active devices and total number of devices in the selected period) always show a period of at least seven days.
“Meta information” tab
- Title: Helps to find a Smart Group in the overview
- Account: The account for which the Smart Group was created; all Virtual Devices in this Smart Group must be assigned to this account.
- Description: A description of the Smart Group or use case
- Filter criteria: The filter criteria with which this Smart Group is defined
- Packet monitoring: A threshold value can be defined here to monitor the number of incoming packets for the smart group. An alarm log entry is created if the threshold value is not reached within the set time interval.
- Packet monitoring active for this smart group: If this setting is activated, an evaluation is carried out every 60 minutes (start of execution is random - not on the hour) to determine whether the defined threshold value has not been reached.
- Threshold value: Number of packets from which an alarm log entry is to be generated.
- Interval: The interval for the threshold value can be defined here. If the interval last hour is selected, the evaluation of the threshold value refers to the last 60 minutes.
- Level: You can define whether this error should have the level ‘Warning’ or the level ‘Error’. This is used for granular filtering for subsequent alarm reports or notifications.
- File attachments: File attachments or background image for the Smart Group
“Virtual Device Template” tab
This tab shows all Virtual Device Templates that are used by Virtual Devices belonging to this Smart Group.
“Virtual Devices” tab
This tab allows you to quickly access individual Virtual Devices from the Smart Group.
“Device Drivers” tab
This tab shows all Device Drivers that are used by Virtual Devices belonging to this Smart Group.
Tab “Alarm Logs”
Alarm logs whose origin is a Virtual Device that belongs to this Smart Group are displayed here.
Tab “Alarm Reports”
Alarm reports created for this Smart Group can be viewed here.
Functions via the XAPI
Users can use the XAPI to query the number of active devices and the number of packets received for an account. This can be used by resellers or solution providers, for example, to implement usage-based pricing models. For further details, see XAPI documentation.