Introduction
This feature is available as part of a “Closed Beta” and can be enabled upon request from the responsible Digimondo customer representative, provided there are still available slots for the beta test.
Dashboards enable an engaging visualization of measured values in combination with master data of Digital Twins. This allows use cases to be effectively monitored and analyzed. This documentation is complemented by a video series that illustrates the key steps for creating dashboards using a practical example. The following video explains this example:
Unified Data Structure as a Basis for Visualizing Measured Values and Master Data
Dashboards can visualize measured values and master data of any number of Digital Twins. To achieve this, a unified data model must be created beforehand to identify data points and name master data. Two key questions need to be clarified:
-
How should Digital Twins be selected for visualization? Digital Twins can be selected based on their meta-information, such as name, parent object, or tags.
-
Which measured values in the form of data points should be displayed? To ensure uniform visualization of measured values, they must exist as data points in all Digital Twins chosen for visualization and use the same key.
An example of the required data structure is explained in the following video:
Creating Dashboards and Adding Widgets
This section describes the general basics relevant to creating dashboards and adding widgets.
Permissions
The “Dashboards” menu entry in the main menu provides an overview of all dashboards. Two new permissions are required for this: Dashboard.manage and Dashboard.read.
A user needs at least the Dashboard.manage permission for the respective account or access area where the Digital Twins for visualization were created. Additionally, the DigitalTwin.read permission is required to display the data.
Creating a Dashboard
In the dashboard overview, a new dashboard can be created using the “Create” button.
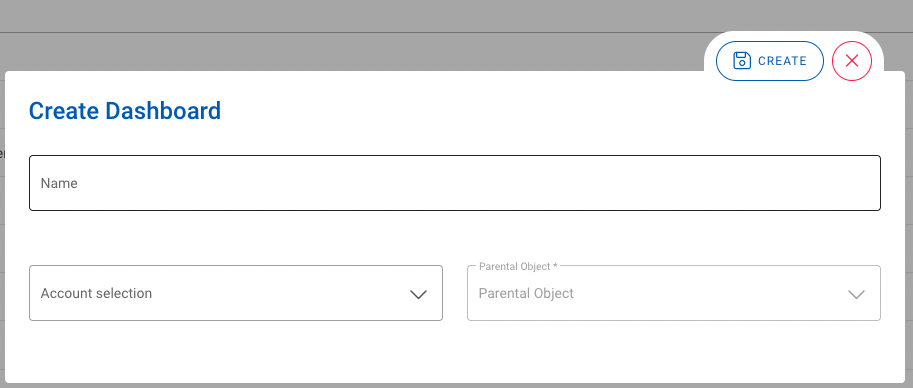
- Name: Name of the dashboard
- Account Selection: The account in which the dashboard should be created
- Parent Object: In niotix, access can be defined at the object level (Digital Twin). Select the desired object within the account to be used as the access area.
Adding Widgets
To add widgets to a dashboard, the “Edit Mode” switch must be enabled. By clicking the “+ Widget” button, new widgets can be added.
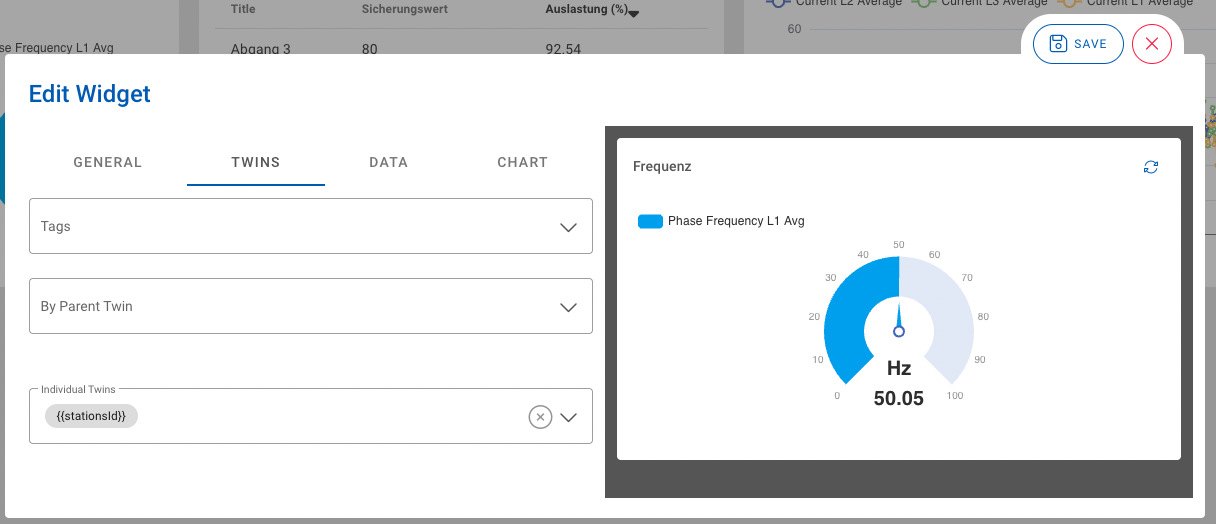
In the “Create Widget” dialog, the widget settings can be configured.
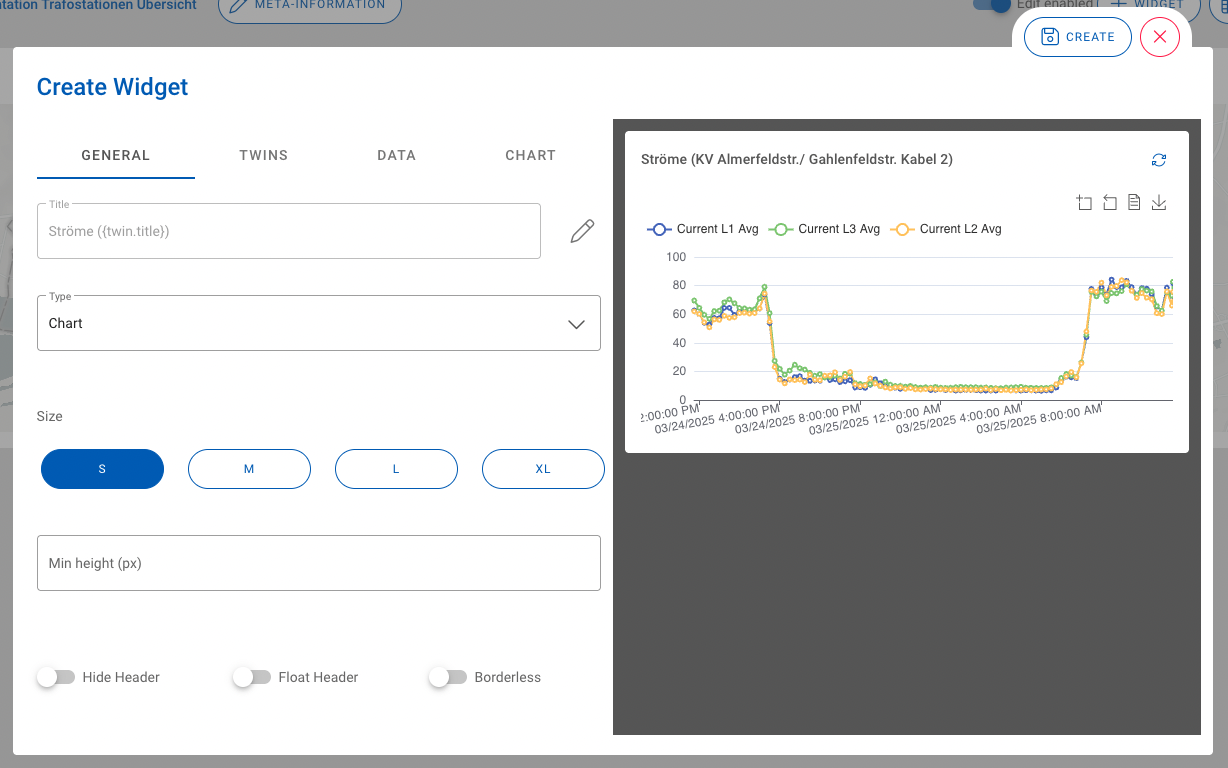
- Title: The title of the widget. If Digital Twins are available for data selection, master data of these twins can be inserted using the pencil icon.
- Type: Defines the type of visualization.
- Empty: No data visualization. Can be used, for example, to display section headers.
- Chart: For visualizing data in the form of charts. All chart types from echarts are available.
- Twin Table: Tabular representation of data.
- Twin Map: Displaying data on a map. Requires an address to be defined for the Digital Twins.
- Size: Defines the width of the widget.
- Minimum Height (px): Defines the minimum height of the widget.
- Hide Header: Defines whether the header with the title should be hidden.
- Floating Header: Defines whether the header should float over the widget.
- Hide Border: Hides the widget border.
The following video explains how to insert a widget using a map representation as an example:
Nested Dashboards
By passing parameters, information can be exchanged between different dashboards. This allows data to be displayed at different granularities – from a high-level overview to a detailed drill-down.
Working with Parameters
To visualize information differently depending on the level of detail, it is possible to display data related to a Digital Twin selected in the parent dashboard in a new dashboard. Navigation to nested dashboards can be created in Twin Map and Twin Table type widgets. To do this, the corresponding dashboard displaying these detailed insights is configured based on dynamic parameters.
In the respective dashboard, parameters can be created using the button.
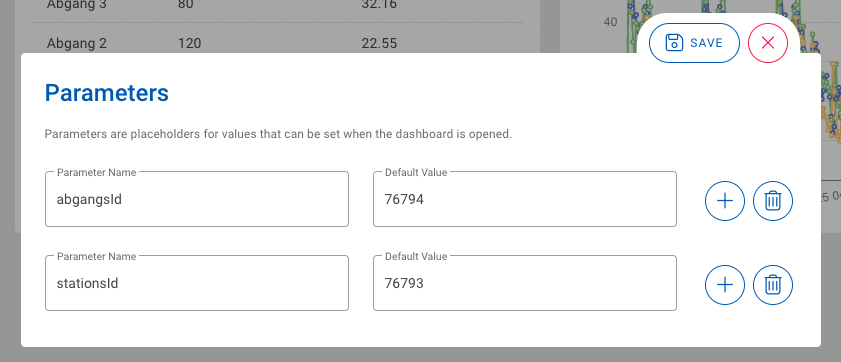
- Parameter Name: The name of the parameter can be freely chosen. A descriptive name should be used.
- Default Value: This is the default value used if no value has been transferred yet. This allows dashboards with dynamic parameters to be edited.
Displaying Detailed Information in a New Dashboard
To display information in a new dashboard, a nested dashboard is selected in the source widget, and “Navigate” is chosen under “Navigation.” Once the nested dashboard is selected, the available parameters of this dashboard are displayed. These parameters can be assigned the values dtwin.id and dtwin.title.
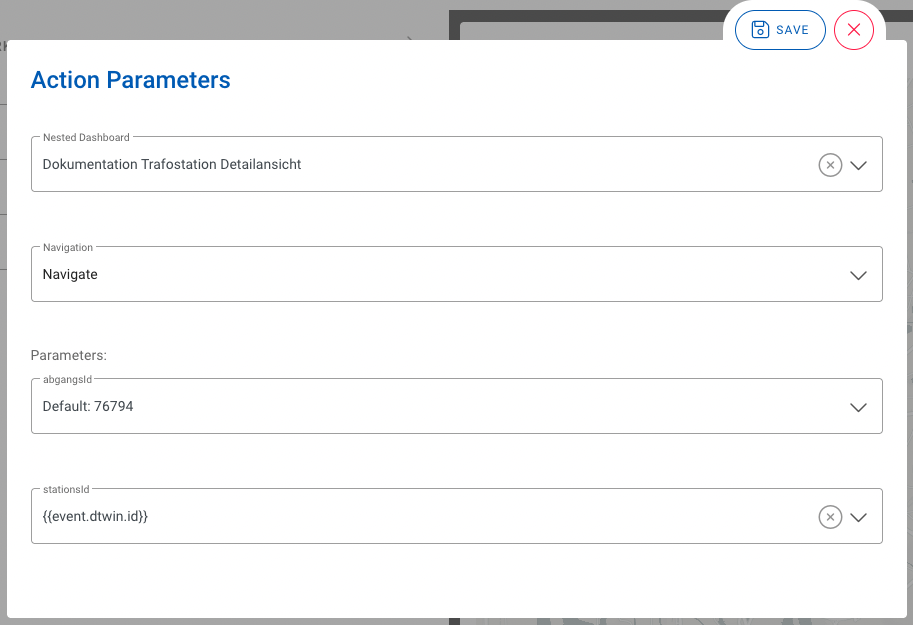
In the target widget, the parameters are used instead of a static value.
The following video explains how to create parameters and use a nested dashboard:
Updating Detailed Information Within the Current Dashboard
If information from individual widgets within a dashboard should be changed by clicking on a source widget, then the same dashboard in which the source widget is located is selected as the “Nested Dashboard” in the action parameters. In this case, “Replace” is chosen as the option under “Navigation.”
The following video explains how to create parameters and update data from individual widgets within a dashboard:
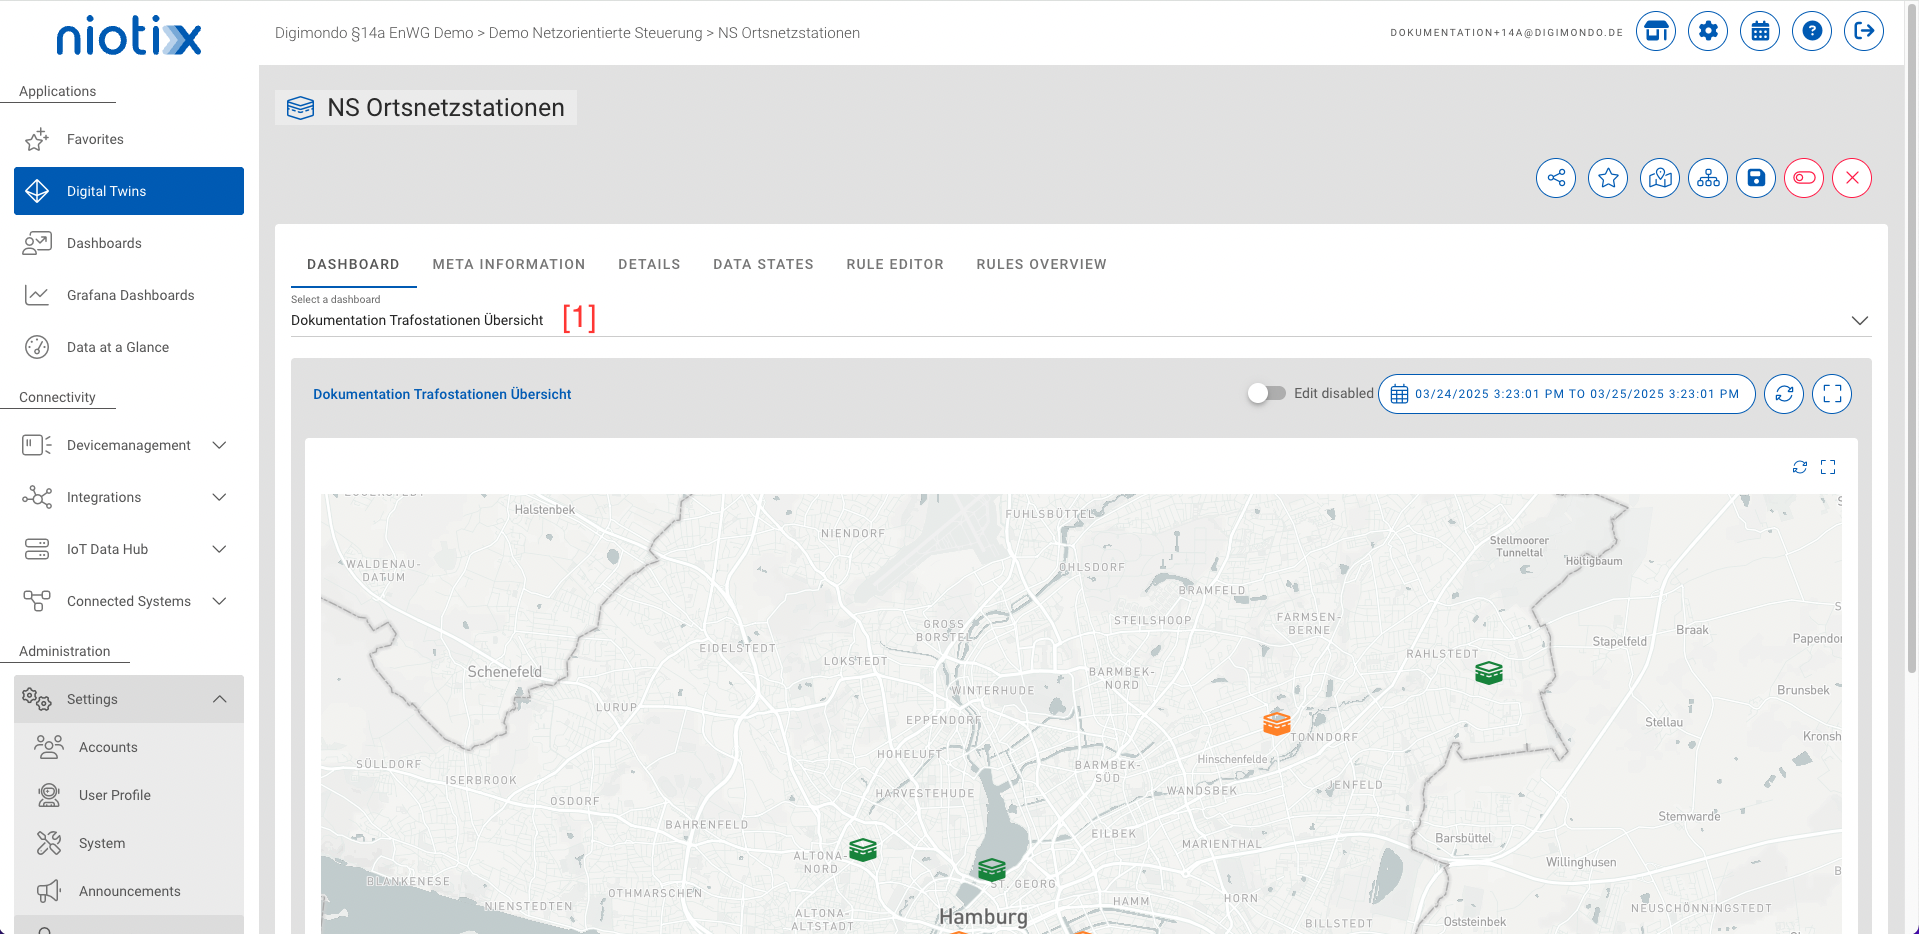
Displaying a Dashboard in a Digital Twin
Dashboards of an account can be embedded in Digital Twins. To do this, the desired Digital Twin is edited. In the “Dashboard” tab, the desired dashboard can be selected via a dropdown [1].
The following video explains how to embed a dashboard in a Digital Twin: