Source “Aggregated timeseries”
Using the source “Aggregated timeseries” you can calculate a new data state based on the historical data of an existing data state.
This is useful, for example, if you want to calculate the maximum value of the last hour or the consumption of yesterday.
The following options are generally available for configuration:
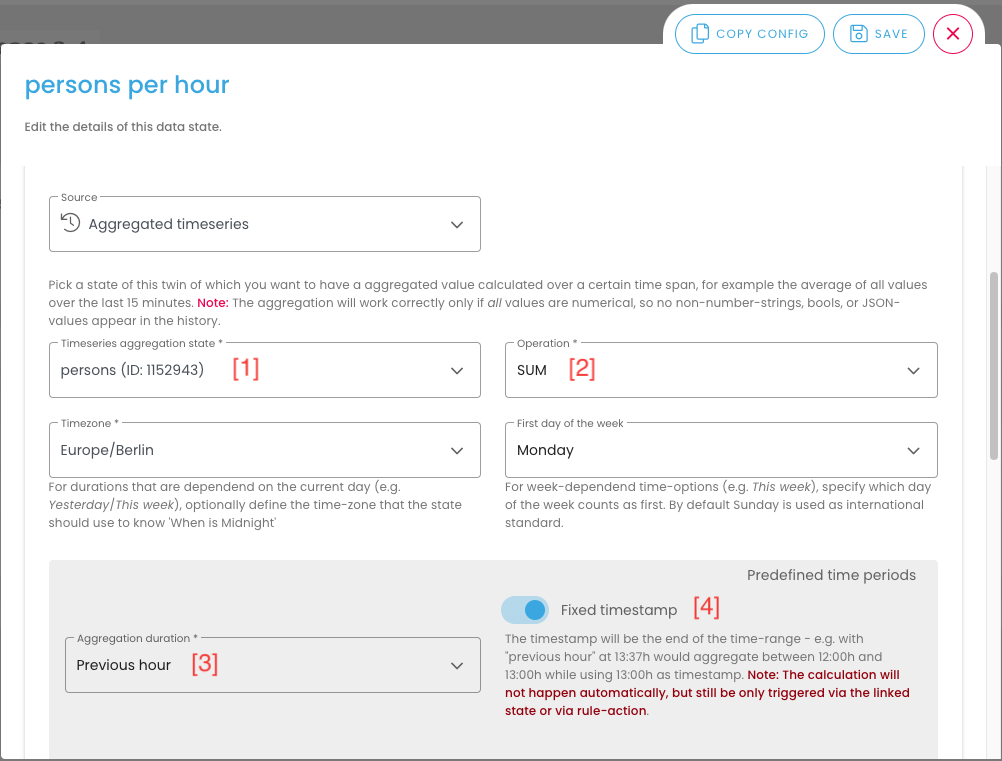
- Time aggregated data state [1] : select here the data state to be used for the calculation
- Operation [2]: select what to do with the historical data of the data states:
- AVG: Calculate the average
- MIN: Determine the minimum
- MAX: Determine the maximum
- SUM: Calculate the sum
- MEDIAN: Determine the median
- COUNT: Count the number of data states
- Difference to last period: Determine the difference of the maximum values from the selected and previous period
- Difference to last value: Determine the difference between the last two values received. This function is helpful, for example, to calculate load profiles.
For simple use cases, the following setting can be done in the first gray box ("Predefined periods"):
-
Aggregation Duration [3]: select the period for the historical data of the selected data states. This is calculated starting from the current time. I.e. if it is 13:00 and an aggregation duration of 1 hour is selected, all data states up to 12:00 are used for the calculation.
-
Fixed timestamp [4]: Select here whether the aggregation duration should be relative to the current time (e.g. one in the past from the time at which the aggregation is triggered) or whether a fixed timestamp should be used (e.g. to always calculate values on the hour). Please note that with the “Fixed timestamp” option, a calculation only takes place if an event occurs that triggers the calculation. This is a change to the aggregated data state [1], the receipt of a sensor packet or a rule with a time trigger that triggers an evaluation of this data state. If no data is found in the time period, the result is expected to be
zero(not0).
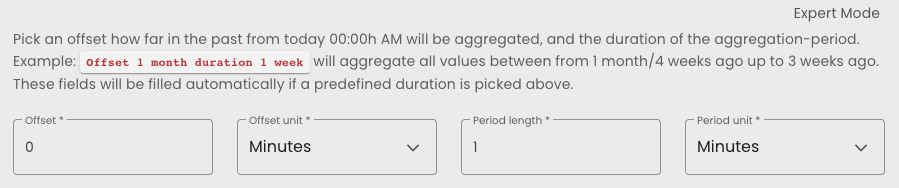
Alternatively, the “Expert mode” is also available in the second gray box below, that allows you to configure detailed settings. In contrast to the “Aggregation duration” before, here you can set up calculations based on full calendar days, months, etc. (instead of calculations based on the current time).
- Offset: Specifies how many units (e.g. days, months) should be calculated back. A value of 0 corresponds to the current unit (e.g. current day, current month). Negative values are not allowed.
- Offset Unit: Specifies the unit for the offset.
- Period length: Specifies the time period from which - starting from the offset - the data is to be aggregated forward.
- Period unit: Specifies the unit for the time duration.
Important notes:
Note 1: Aggregation will only work correctly if all values are numeric, i.e. no non-numeric-strings, Boolean values or JSON values are present in the history.
Note 2: Regardless of the selected time period, at most the latest 5000 values will be aggregated.
Note 3: The time aggregated data states store their own value in the database and are recalculated whenever the connected data point updates. I.e. if the configuration of the time aggregated data states is changed afterwards, the already calculated values will not be recalculated.
Note 4: If an aggregation duration is selected for the time aggregated data state that is lower than the transmission interval of the sensor, it can happen that no packet was received in a certain aggregation interval. If there is no packet within a aggregation interval, niotix uses 0 for the calculation.
Note 5: As soon as the “Aggregation Duration” is selected, the fields in the “Expert Mode” area fill automatically. Conversely, the “Aggregation Duration” will deactivate if the fields from the “Expert Mode” are filled manually.
Note 6: Depending on the choice of aggregation duration, the start point of the aggregation is set differently.
-
If “This week” is selected, the start time is set on Mondays at 00:00:00 and the status updates are returned from that time. Example: if now is 8 February at 13:37:37.020 UTC+2, all status updates from 1 February 13:37:37.020 UTC+2 will be returned.
-
If “7 days” is selected, status updates from the last 7 days will be returned to the second. Example: if it is now Wednesday 8 February at 13:37:37.020 UTC+2, the status updates from Monday 6 February at 00:00:00.000 UTC+2 will be returned.
-
If “7 days” is selected in expert mode, the last full 7 days will be returned. Example: If it is now 8 February at 13:37:37.020 UTC+2, the status updates from 1 February 00:00:00.000 UTC+2 will be returned.
Examples
Example 1 on the configuration options
To illustrate the various configuration possibilities, here is an example:
The initial situation is a data state with the received temperatures listed in the first two columns.
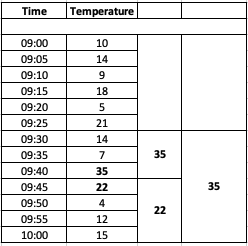
The goal is to find out the maximum temperature of the last 15 min. by means of a temporally aggregated data states.
To do this, use the “Time aggregated data state” area to select the corresponding data state (in this example, “Temperature”) from which an aggregation is to be created over a period of time. Select the maximum value (“MAX”) under “Operation”, then a period of 15 minutes under “Aggregation Duration” and the type “Number” for the visualization in the “Type” field. You can optionally set the first value in the “Value” field (the value will be overwritten by the data source at the first update). Click “Save”, then the time aggregated data state will appear in the dashboard and in the list of data states.
In our example from above, the value 22 °C is shown as the maximum temperature in the last 15 minutes (see column 3: the maximum is taken from the data from 10:00 to 09:45). You can do the same principle with other operations (e.g. “MIN”).
If, on the other hand, in the same example, you select the operation “Difference to last period” and a period of 15 minutes, then the difference of the maximum temperatures between the last two intervals will be shown here.
For our example this would be the difference from:
- The 1st interval (from 9:45 to 10:00), where the maximum temperature is 22 °C.
- The 2nd interval (from 9:30 to 9:45), where the maximum temperature is 35°C.
The difference between the two temperatures is displayed, i.e. 22°C-35°C = 13°C.
Example 2 about the configuration options
If, on the other hand, the goal is to find out the maximum temperature of 2 days ago from the whole (calendar) day for the temperature values given above, then you have to choose the expert mode.
With the “offset” of 2 and the offset unit “day” you select the day before yesterday (2 days ago). The following table gives an example of the offset function:
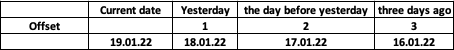
Select 1 as the time duration and “Day” as the time unit to include the entire calendar day as the time period for the evaluation.